 Home
Home Research
 Publications
 Outreach
 CV
CVRESEARCH
LUNAR RECONNAISSANCE ORBITER
DIVINER LUNAR RADIOMETER EXPERIMENT

The Diviner Lunar Radiometer Experiment (DLRE) is one of seven instruments aboard NASA's Lunar Reconnaissance Orbiter (LRO) currently in orbit around the Moon. Details of LRO can be found at NASA's Goddard Space Flight Center. The Diviner instrument has been mapping the global thermal state of the Moon since July 2009 acquiring visible reflectance and thermal emission data in nine spectral channels spanning wavelengths 0.3 – 400 μm. The broad science goals of the instrument are (1) Characterize the lunar thermal enviroment, (2) Map surface properties such as thermal inertia, rock abundance, and silicate mineralogy, and (3) Determine the locations and temperatures of volitile cold traps in the polar regions. For more details on the instrument visit the Diviner website, and to see some work on a project using Diviner rock abundance data see my LPSC 2013 poster.
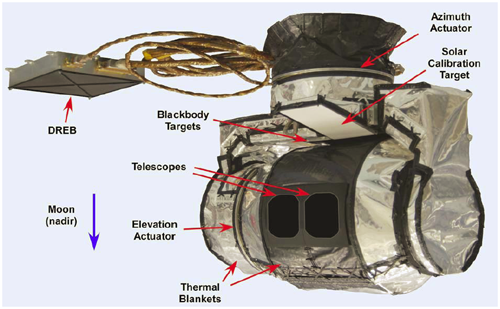
Diviner instrument with major components labeled.
Gridded Data Products – Diviner acquires 21 measurements in 9 spectral channels every 0.128 seconds. Using data acquired during the LRO primary mapping mission, I've created gridded global datasets which have been archived, along with the rest of Diviner's data on NASA's Planetary Data System (PDS). LRO is in a polar orbit (i.e. its orbit plane is inclined 90° relative to the lunar equator) and is nearly fixed in inertial space. As the Moon orbits the Earth, the longitudes of the ascending and descending legs of the orbit drift from -180° to +180° longitude once every month, therefore Diviner generates two global maps of the Moon every month. The sub-spacecraft local time drifts about 2 hours every map cycle, cycling between 0 and 24 hours in a year. This means local illumination conditions, and therefore surface temperatures, change with each map. Diviner's ground track width at the equator is about 3.4 km (2.1 mi) and as a result, monthly maps have significant space where data is absent (gores) between orbit tracks. Since the local time is different in each map cycle, simply combining maps is not particularly useful. For more detail about the gridded products see our LPSC abstract and also my presentation from the LRO Diviner Data Users Forum in Houston, TX March 2011.
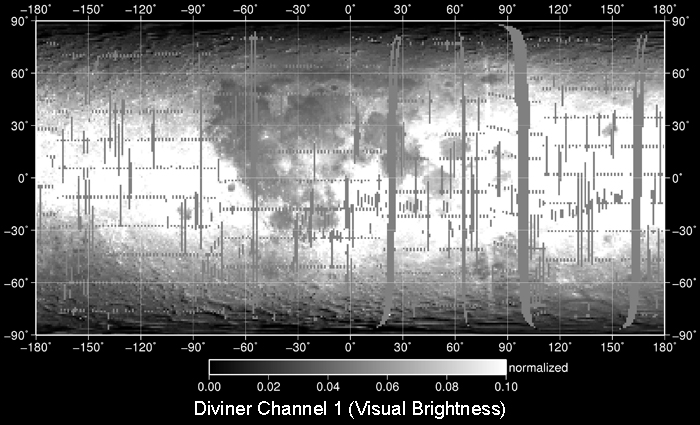
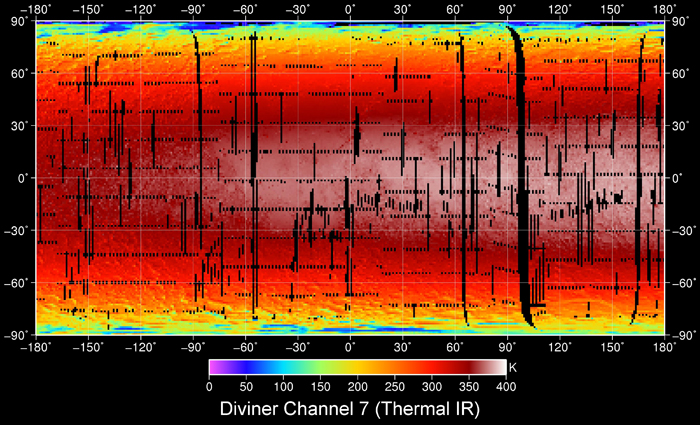
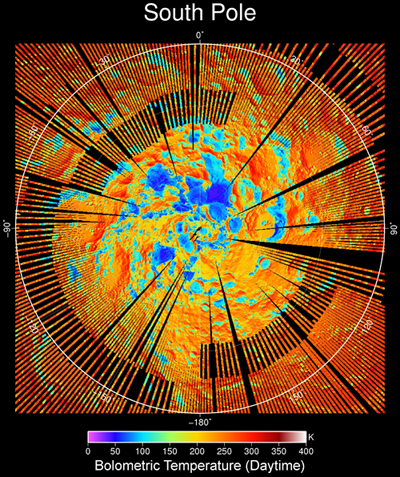
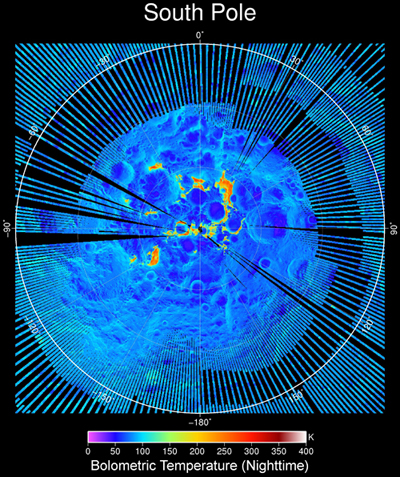
(Top) Diviner Channel 1 gridded visual brightness map and (middle) Diviner Channel 7 gridded daytime brightness temperatures for October, 2009, at 1 pixel per degree resolution. (Bottom) Polar stereo graphic projection of daytime and nighttime bolometric temperatures of the lunar south pole at 240 m pix-1 resolution. Bolometric temperature is a measure of the spectrally integrated flux of infrared radiation emerging from the surface, and is computed from the measured brightness temperatures in the Diviner infrared channels. For the purposes of quantifying the overall heat balance of the surface and comparing with available models, the bolometric brightness temperature is the most fundamental and interpretable measurable quantity.
Lunar Surface Temperatures – Diviner is revealing the extreme nature of the lunar thermal environment. Superposed on the large-scale trends due to latitude, time of day, and season, the surface temperature of the Moon can exhibit extreme spatial variations at all length scales. Large thermal gradients can be maintained throughout the diurnal cycle over short spatial scales (10's cm or several inches) due to the low thermal conductivity of the regolith and the lack of an atmosphere and oceans like the Earth. Therefore within a single Diviner surface footprint (~250×250 m or ~820×820 ft) temperatures can exhibit extreme variations and the temperature retrieved from Diviner will be an integration of the complex thermal environment within its field-of-view.
 To aid in our interpretation of Diviner data, I am developing a 3-diminsional heat
flow model of the lunar regolith to understand how small-scale slopes, shadows, and
rocks within a Diviner surface footprint influence temperatures derived from Diviner
observations. The model includes topography and ray tracing of the illumination while
allowing for variations both vertically and laterally of the thermophysical
properties of the regolith.
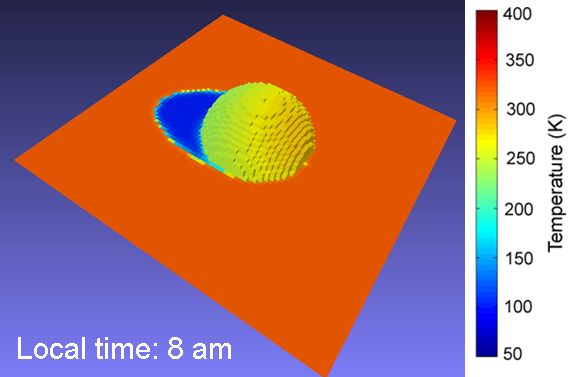
The example shown here in the figure and animation shows the temperatures of
a 14 cm (5.5 in) diameter spherical rock embedded in the lunar regolith.
The nighttime rock temperature differs from the surrounding regolith due to different
thermophysical properties of the rock and daytime surface temperatures vary within
the scene from the topography causing slope effects and shadowing.
For more details, see my
LPSC abstract presented in Houston,
joint EPSC-DPS conference
abstract presented in Nantes,
France in 2011, and EPSC conference
abstract presented in Madrid,
Spain in 2012.
To aid in our interpretation of Diviner data, I am developing a 3-diminsional heat
flow model of the lunar regolith to understand how small-scale slopes, shadows, and
rocks within a Diviner surface footprint influence temperatures derived from Diviner
observations. The model includes topography and ray tracing of the illumination while
allowing for variations both vertically and laterally of the thermophysical
properties of the regolith.
The example shown here in the figure and animation shows the temperatures of
a 14 cm (5.5 in) diameter spherical rock embedded in the lunar regolith.
The nighttime rock temperature differs from the surrounding regolith due to different
thermophysical properties of the rock and daytime surface temperatures vary within
the scene from the topography causing slope effects and shadowing.
For more details, see my
LPSC abstract presented in Houston,
joint EPSC-DPS conference
abstract presented in Nantes,
France in 2011, and EPSC conference
abstract presented in Madrid,
Spain in 2012.
Model results for embedded 14cm spherical rock for a diurnal cycle (24 hours of local time).
MARS POLAR LANDER
The Mars Polar Lander testbed at UCLA (1999).
As an undergraduate student and the first year of graduate school, I had the opportunity to work on the Mars Polar Lander, a robotic spacecraft sent to land on the south polar layered deposits of Mars. The primary objectives of the mission included:
◦ Study the present-day climate, weather, and seasonal changes in the polar region
◦ Study the exchange of water vapor between the atmosphere and regolith
◦ Search for evidence of climate change in layered deposits
◦ Search for near-surface ground ice in the polar regions
◦ Analyze the soil for physically and chemically bound water and carbon dioxide
◦ Study the geology of the south polar layered deposits
My work on characterizing the landing site is included in a paper published in the Journal of Geophysical Research and my work on acoustics of the atmosphere at the landing site to support the microphone instrument onboard the spacecraft was published in a paper in the same journal.